
MTTSL IPO Investment Analysis
All data backed by prospectus

Company: MTT Shipping and Logistics Berhad (Registration No. 201901004019 / 1313346-A)
Prospectus Date: 26 March 2026
Listing: Main Market, Bursa Malaysia Securities Berhad
1. What the Company Does
MTTSL is an investment holding company that, through its subsidiaries, operates as the largest domestic container liner shipping company in Malaysia (41-46% market share by cabotage volume).
Core Businesses
Container liner shipping (domestic cabotage + regional/international routes)
Vessel chartering (time charter to third-party liner companies)
Container storage and depot services (via 71.4%-owned ICSD)
Dry bulk shipping (via 39%-owned joint venture Lestari Maritime)
Liquid bulk logistics (via 60%-owned United Bulk Logistics)
Chemical tankers (via 90%-owned MTT Kenyalang)
Harbour tug services (via 50% JV Harbour 360)
Shipping agency (for Evergreen Group and others)
Containerised automotive vehicle shipping
Proprietary shipping software (iKapal, via 55%-owned Kapal Solutions)
Headquarters: Shah Alam, Selangor
Branch Offices: 9 locations across Malaysia (Johor Bahru, Kuching, Bintulu, Sibu, Miri, Tawau, Sandakan, Kota Kinabalu)
Route Coverage: 34 ports across Malaysia, Singapore, Thailand, Brunei, Indonesia, India, and China
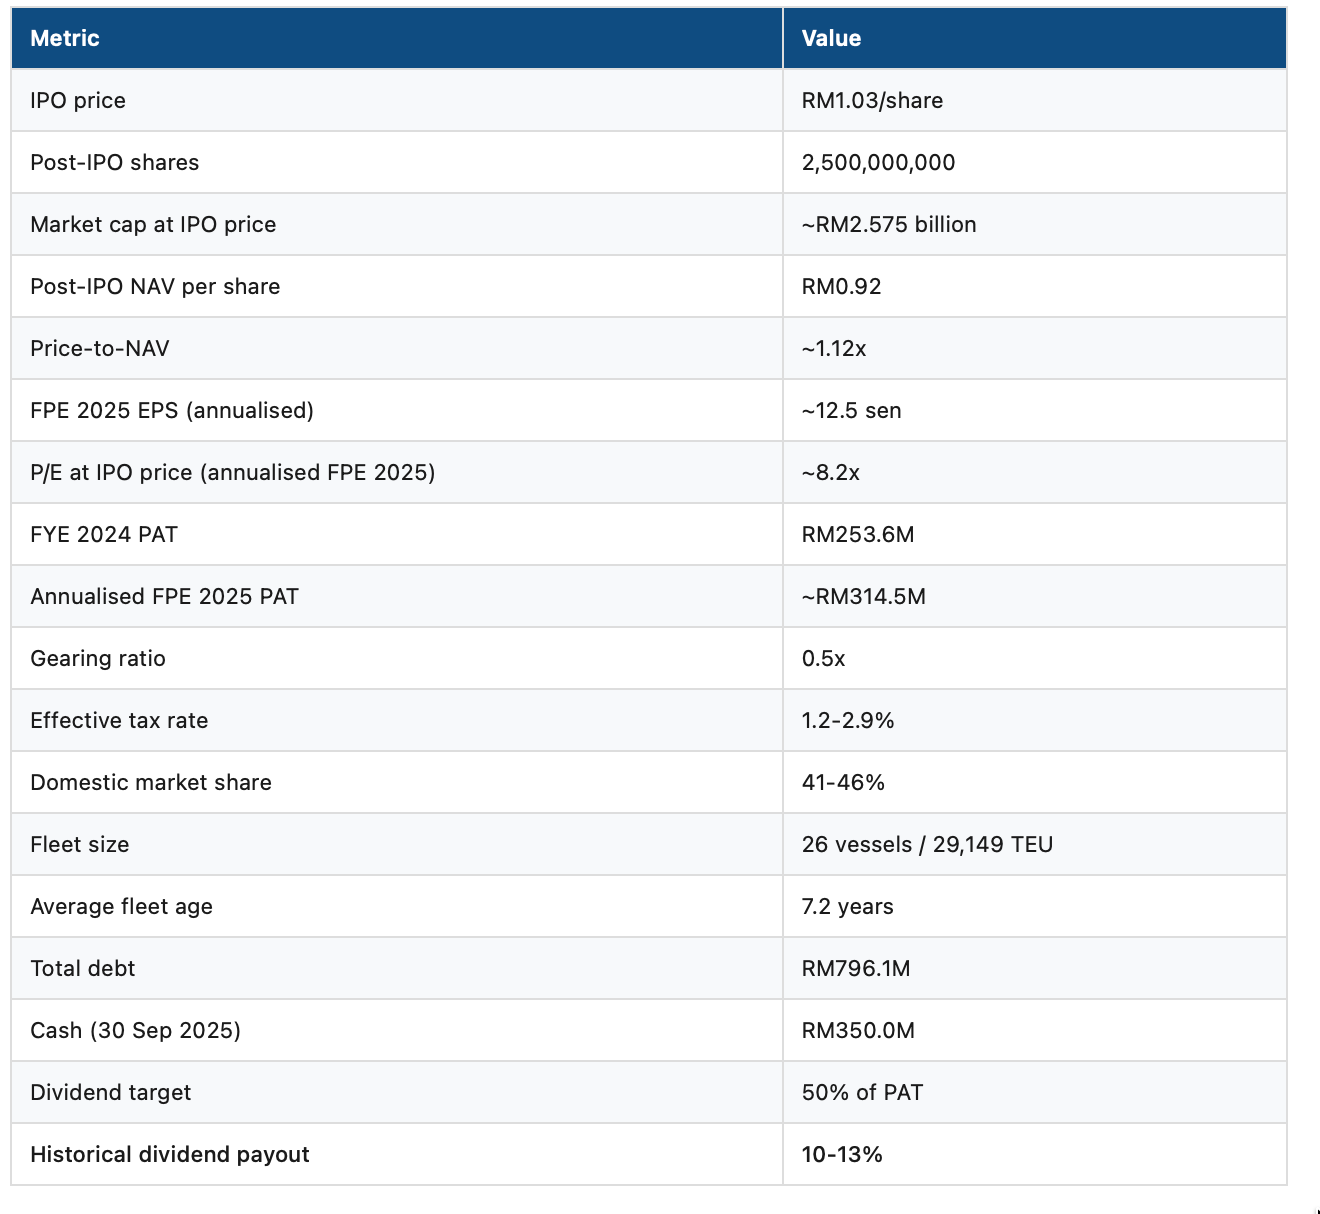
2. IPO Details
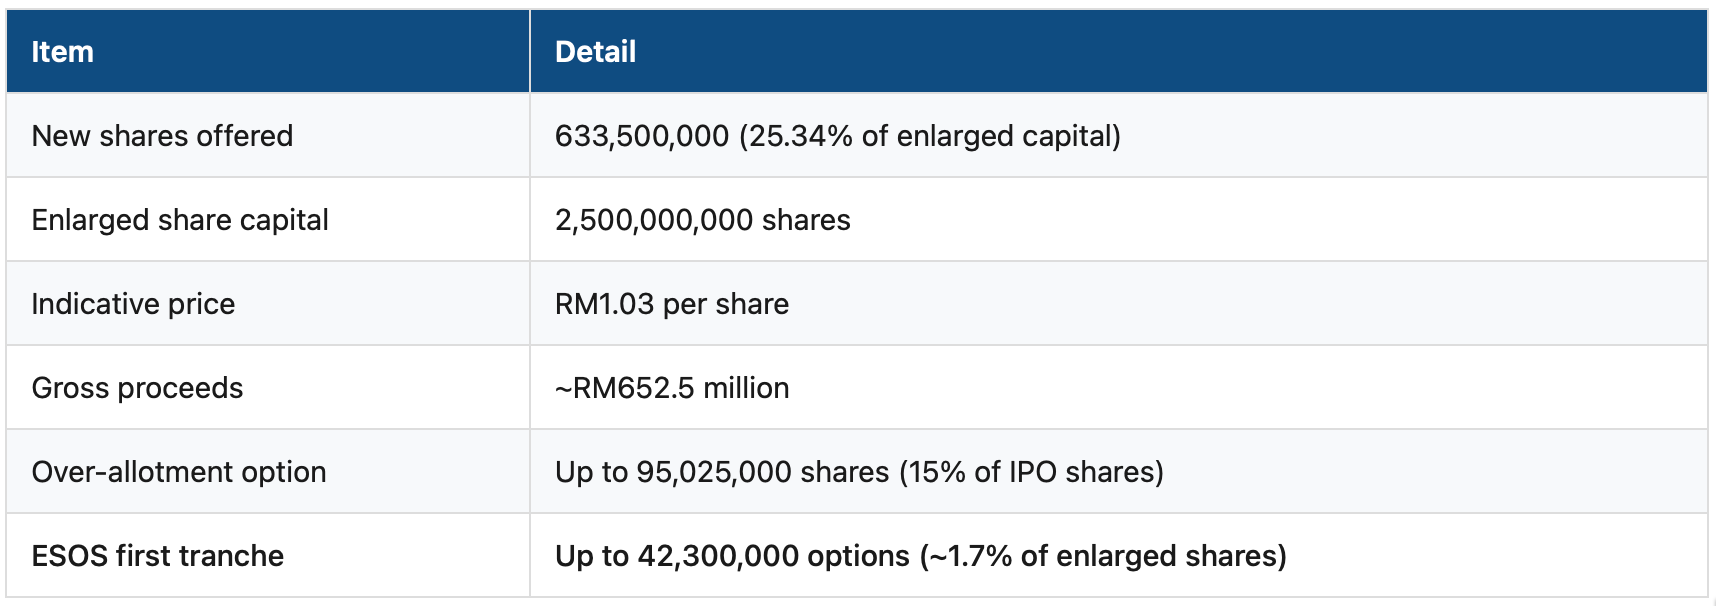
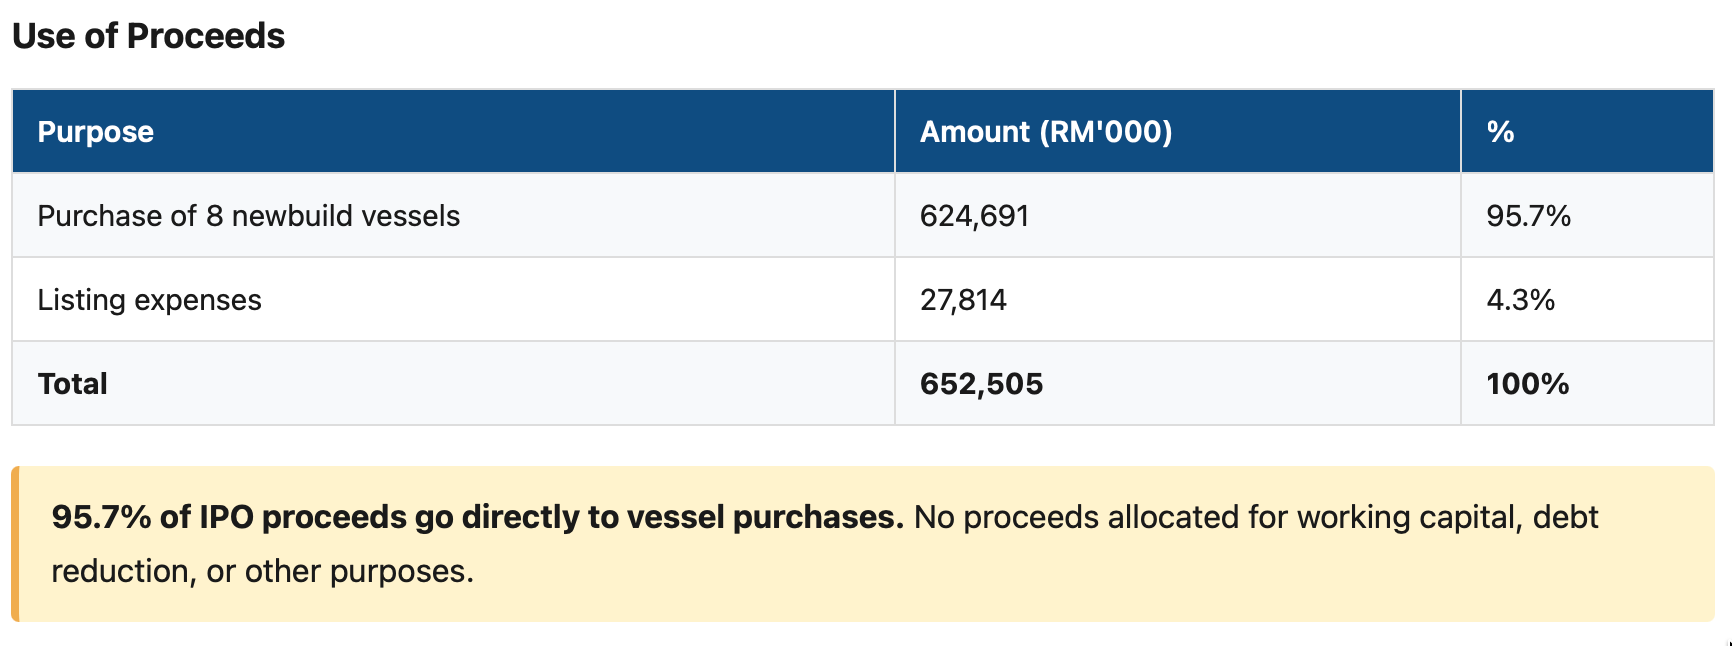
Use of Proceeds
Previous IPO Attempt
The company applied to SC on 6 August 2021, was approved 9 December 2021, but withdrew on 22 December 2021 citing unfavourable equity market conditions. Now proceeding due to stronger financial performance.
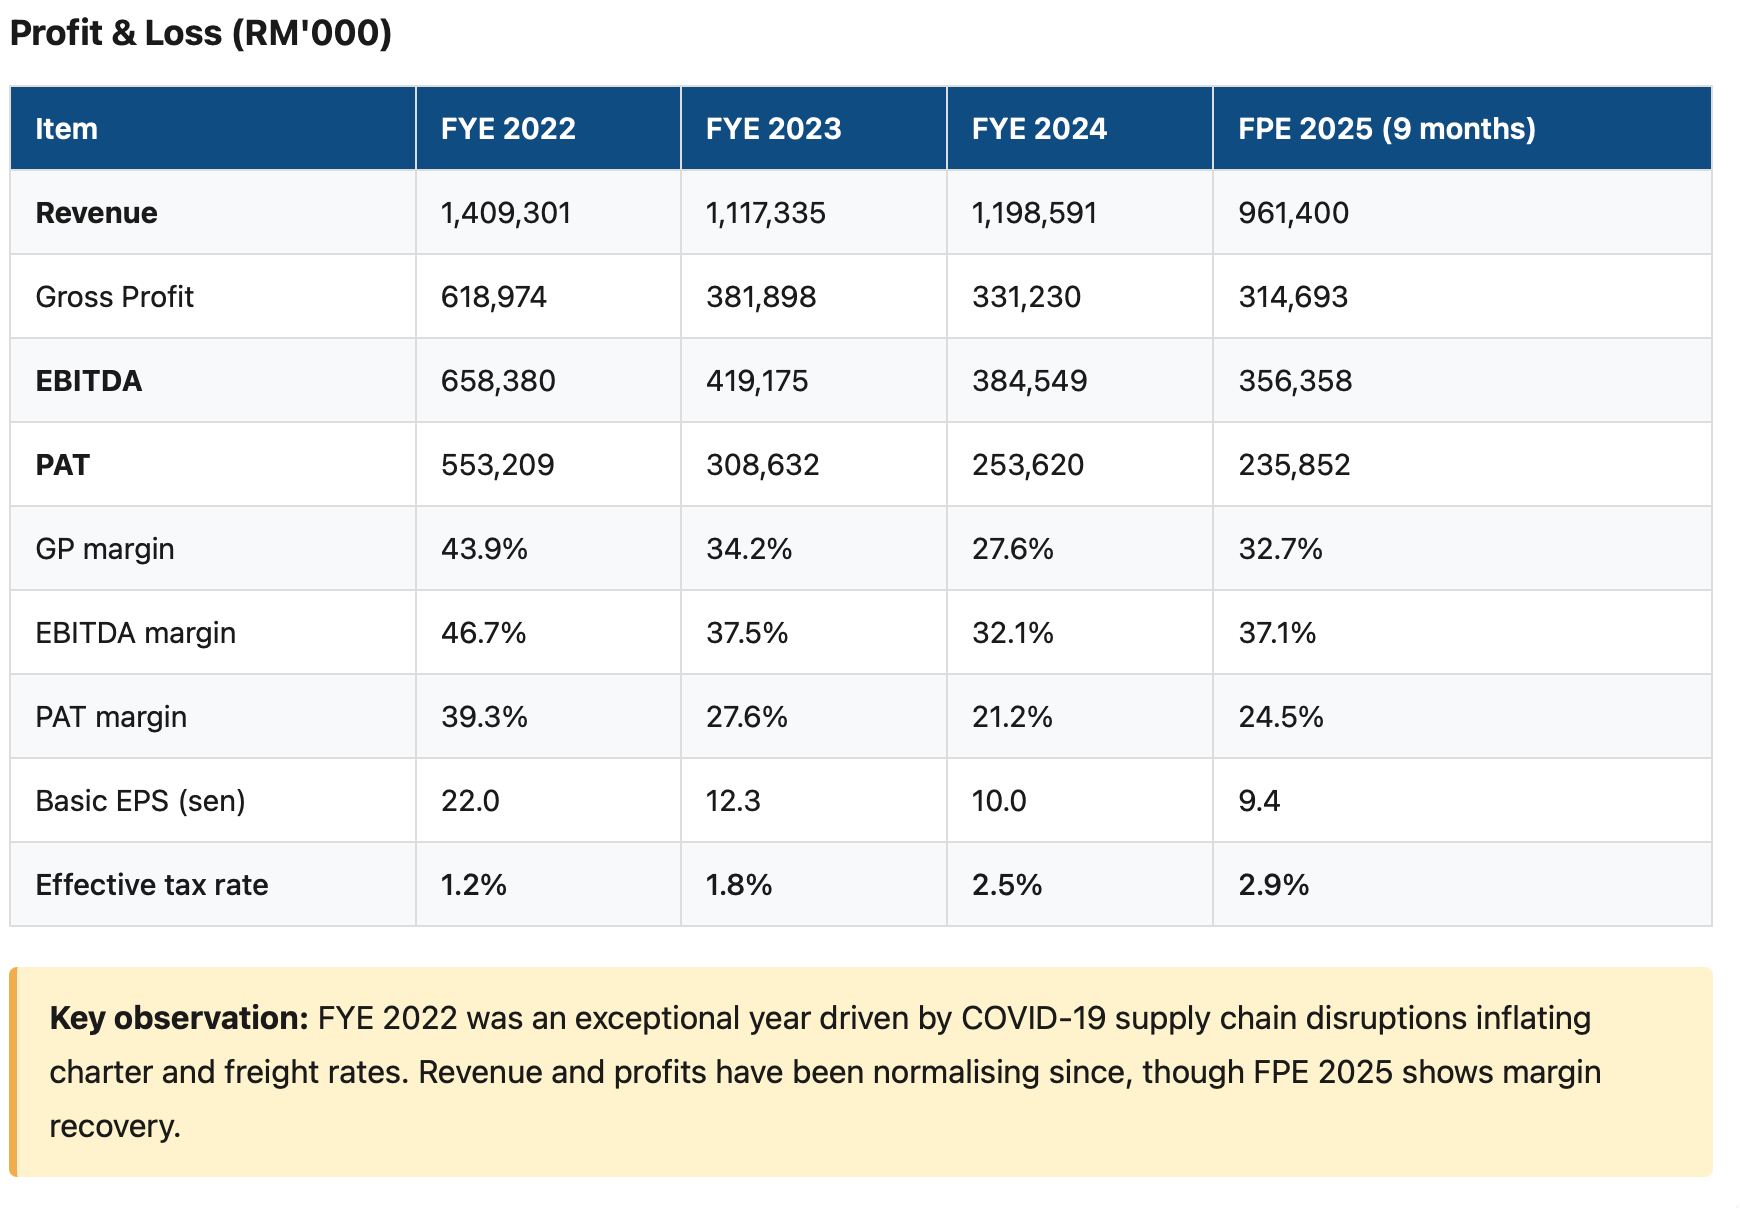
3. Financial Performance
GP Margin by Segment (FPE 2025)
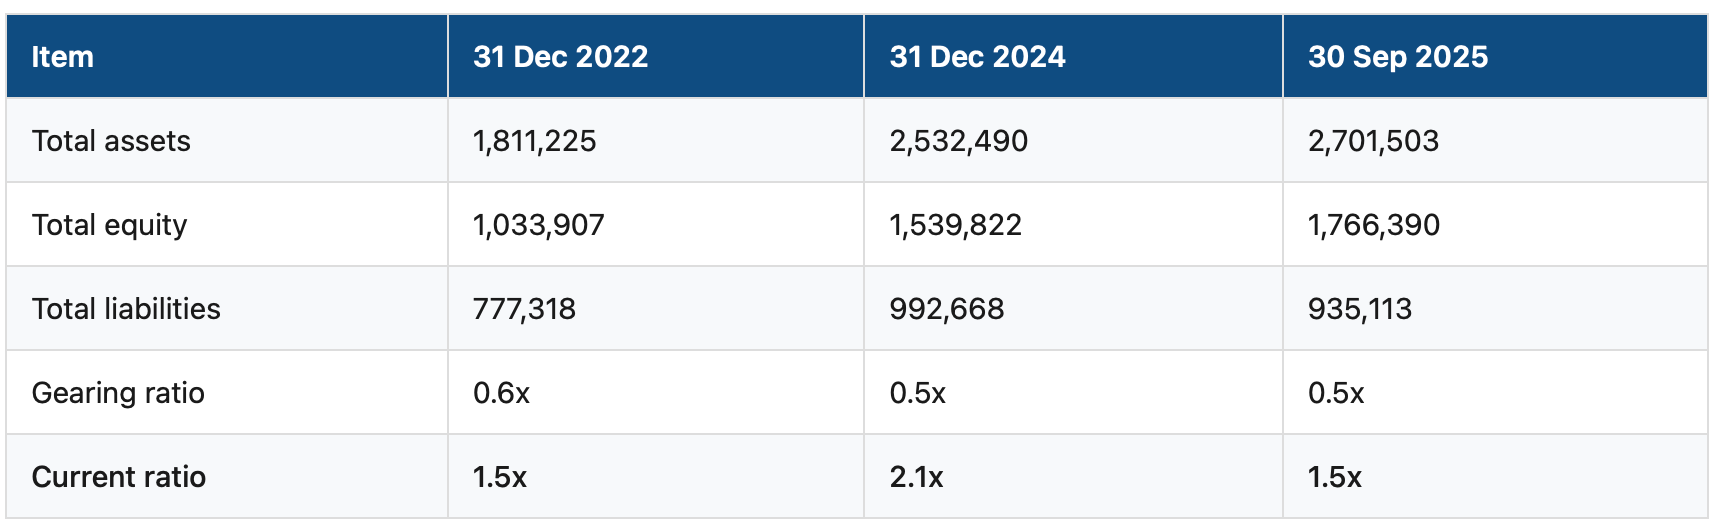
Balance Sheet (RM’000)
Cash Flow (RM’000)
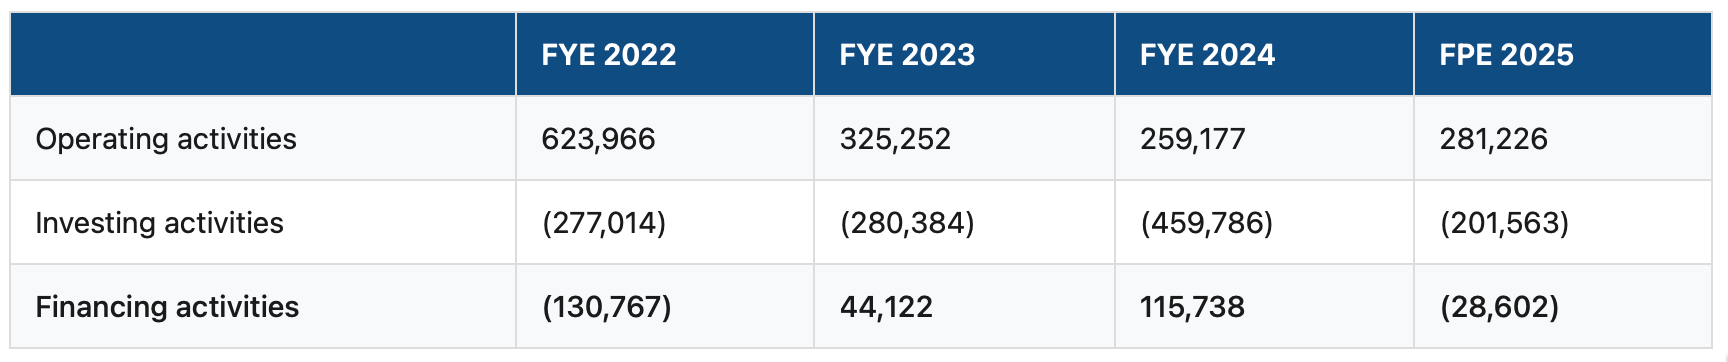
Average annual operating cash flow (FYE 2022-2024): RM402.8 million.
Tax Advantage
Profits from operation of Malaysian-registered vessels are exempt from taxation under Section 54A(1) of the Income Tax Act. This is why the effective tax rate is only 1.2-2.9% — a major structural advantage, but also a regulatory risk if the law changes.
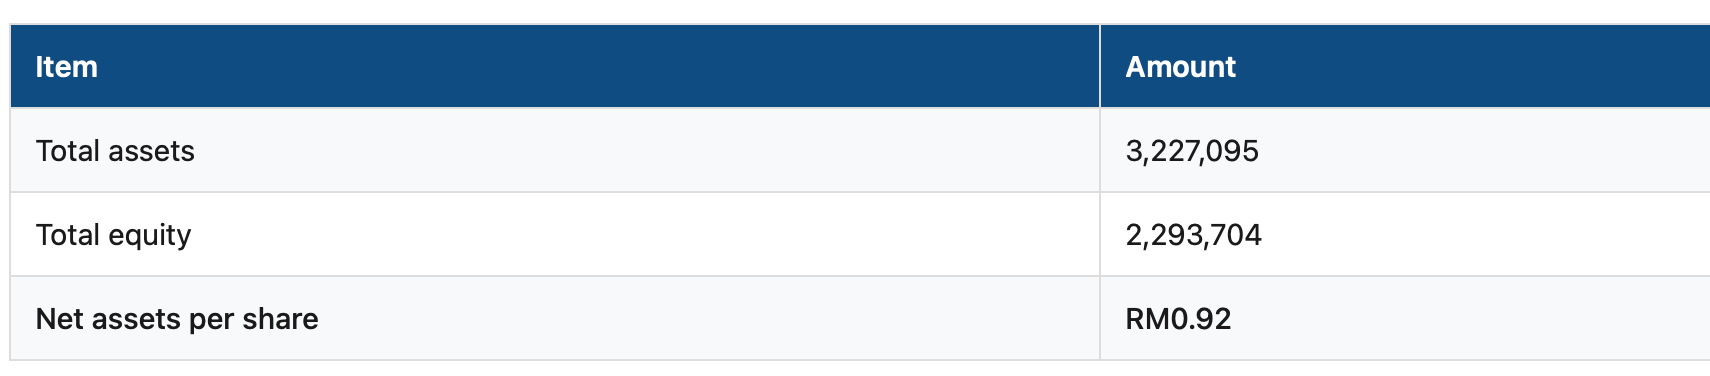
Pro Forma Post-IPO (RM’000)
4. Debt Profile
Total Outstanding Borrowings: RM796.1M (as at 30 September 2025)
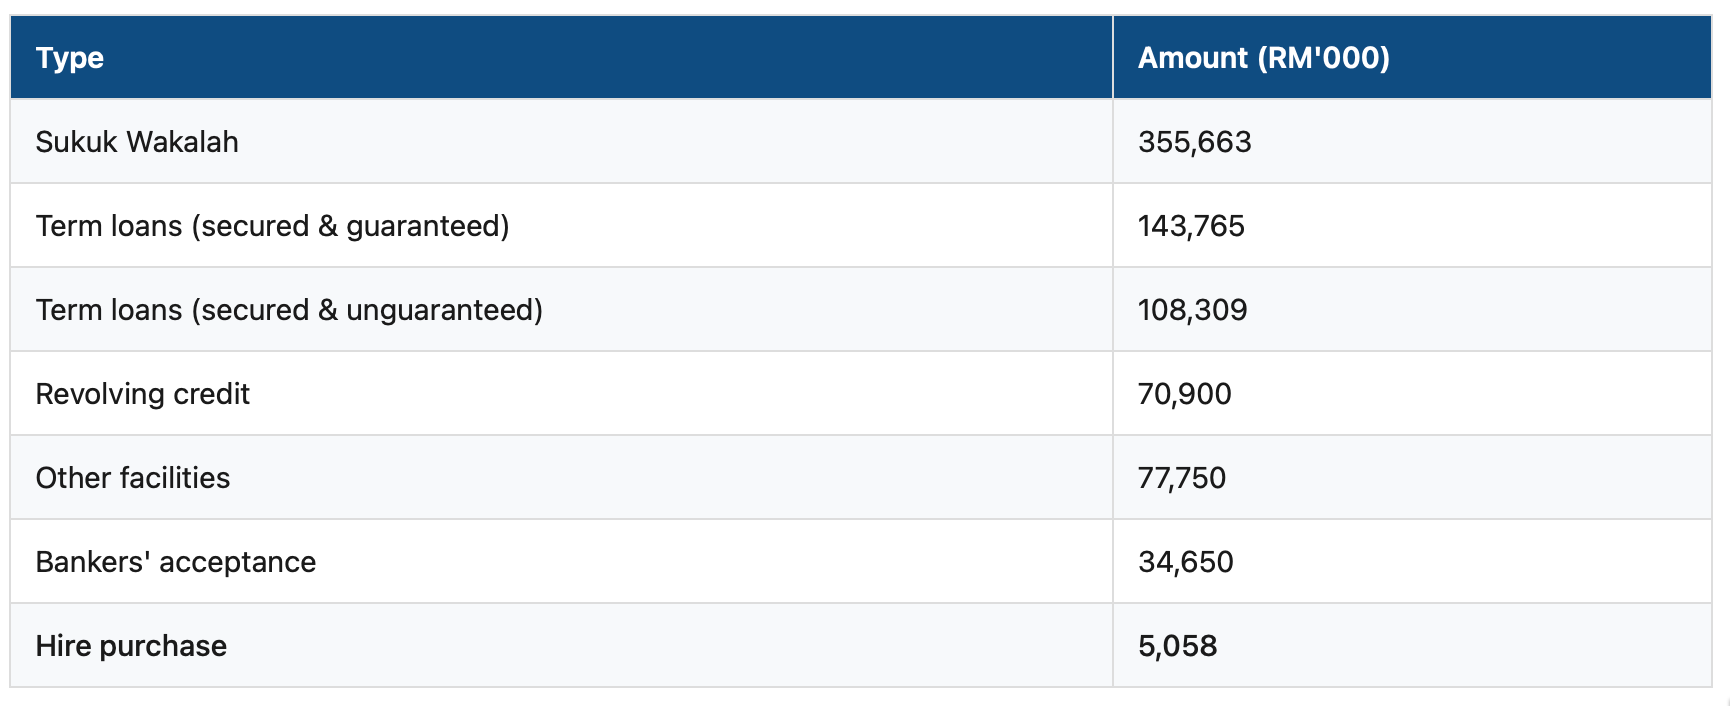
Sukuk Wakalah rated AA3/Stable/P1 (RAM Rating Services)
No defaults or covenant breaches on any borrowings
RM180M Sukuk tranche maturing August 2026 (near-term refinancing need post-listing)
Personal guarantees from certain directors to be replaced with corporate guarantees upon listing
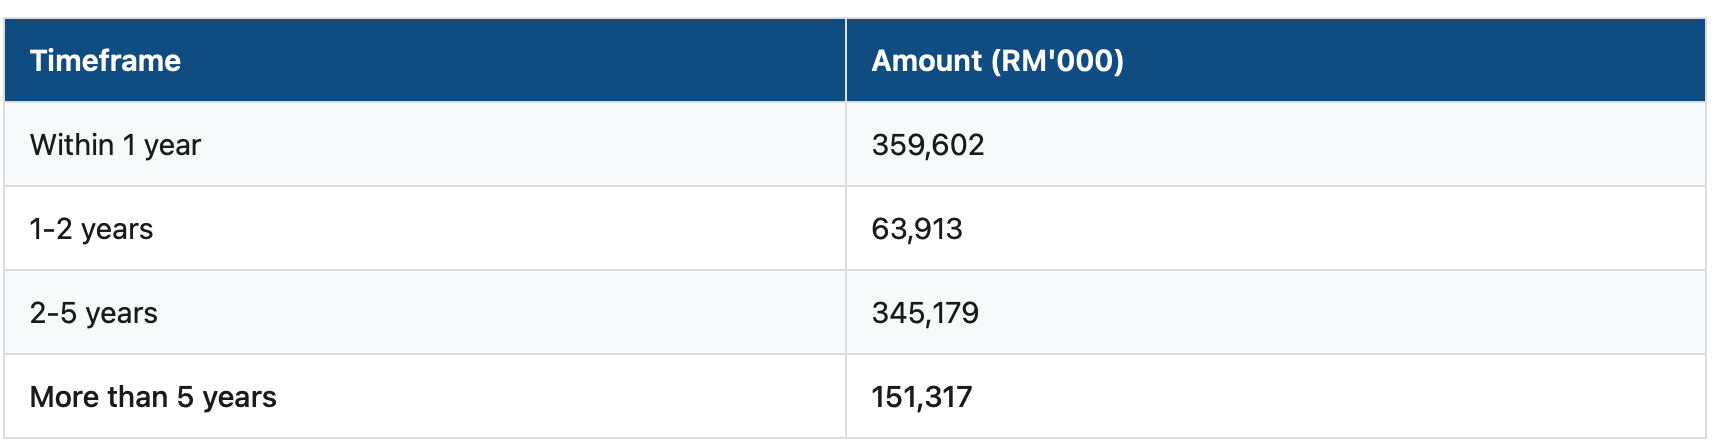
Maturity Profile
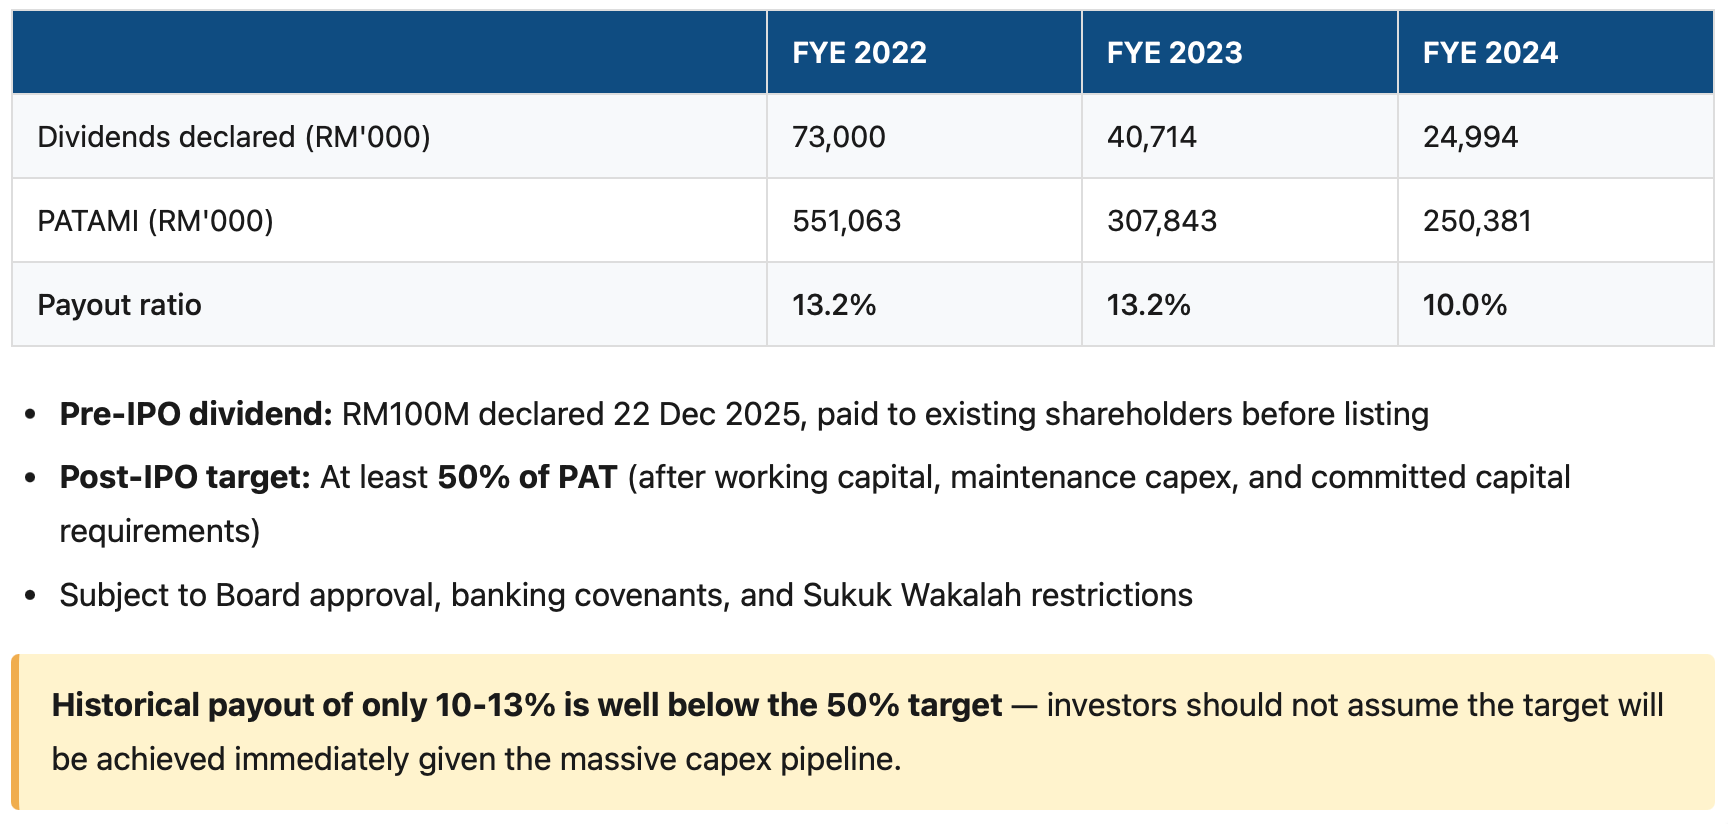
5. Dividend Policy
Historical Dividends
6. Ownership Structure (Pre-IPO)
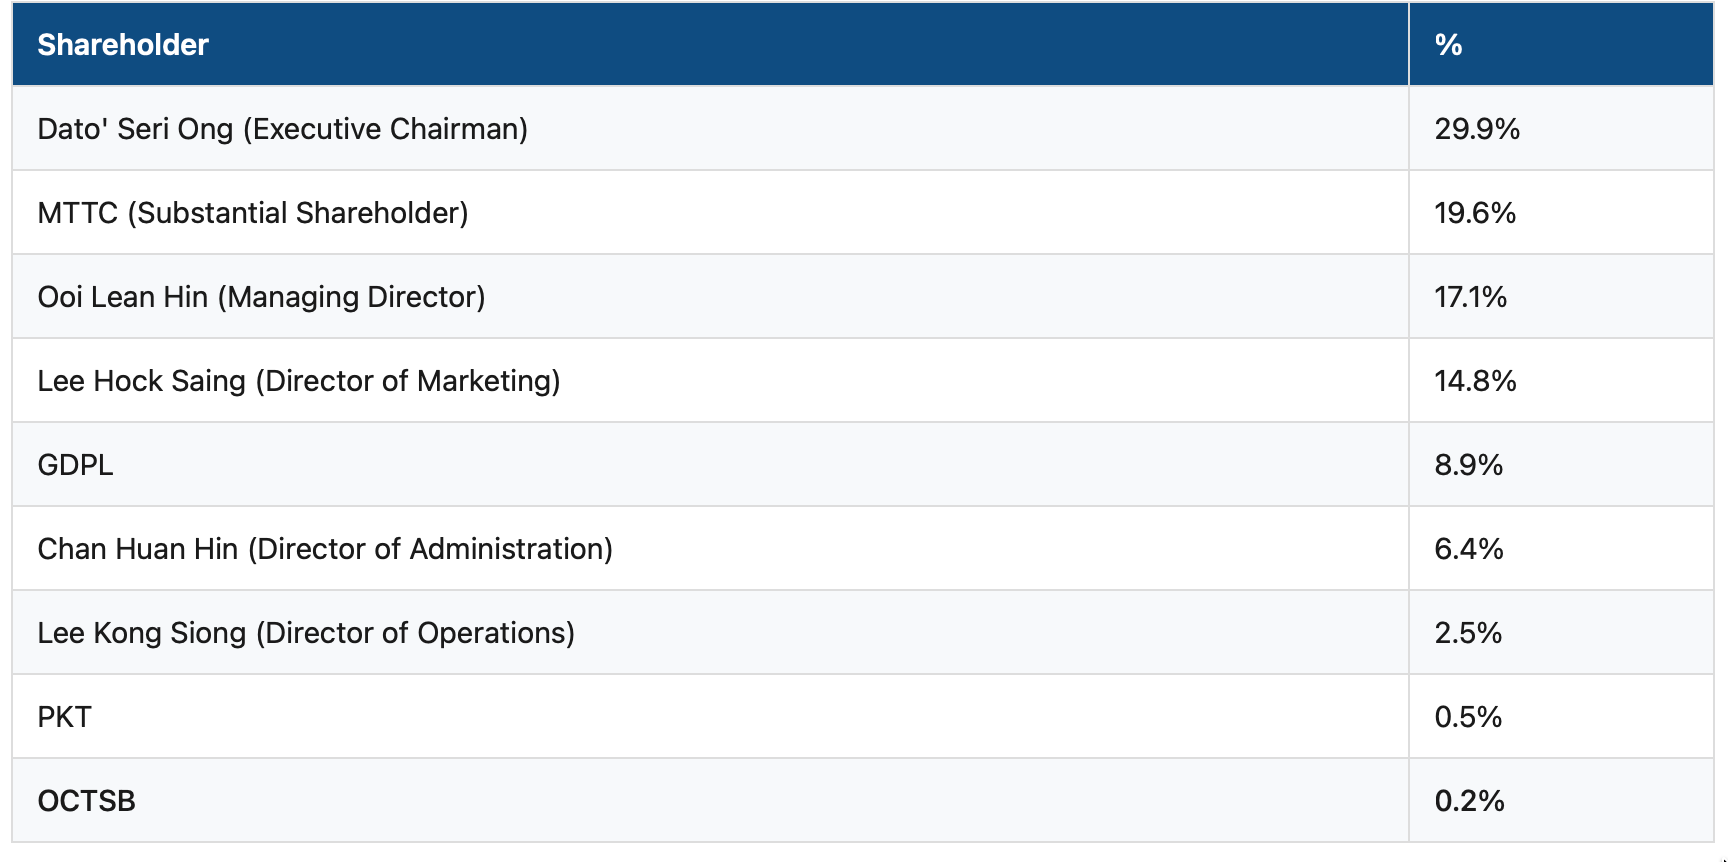
All shareholders have equal voting rights (no dual-class shares)
Founding group + family collectively hold vast majority of pre-IPO shares
No arrangement exists that may result in a change of control post-IPO
Evergreen Taiwan (via Peony) holds 28.65% of subsidiary ICSD — strategic alignment
Key Family Relationships
Dato’ Seri Ong is the father of Clarice Ong (Director of Corporate Affairs)
Dato’ Seri Ong is the brother of Ong Guat Ee (substantial shareholder via MTTC and OCTSB)
7. Management Team
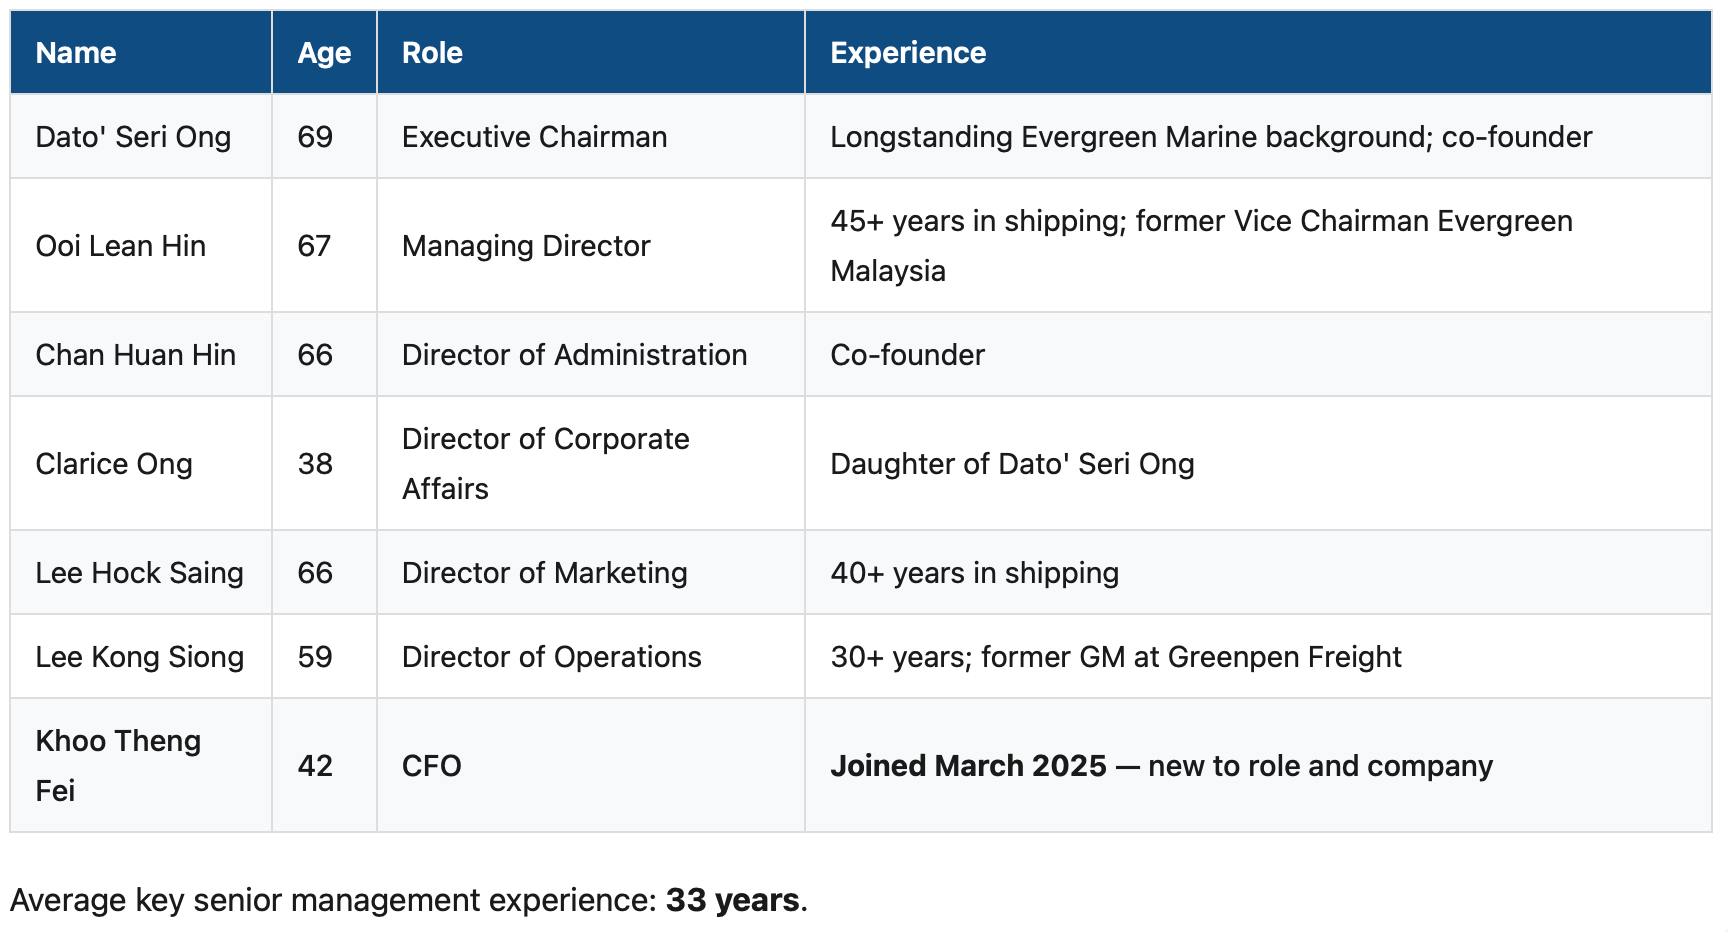
Concern: Co-founders are aged 59-69. Succession planning is critical. The CFO only joined in March 2025, less than one year before the IPO.
8. Competitive Strengths (Why to Invest)
8.1 Dominant, Protected Market Position
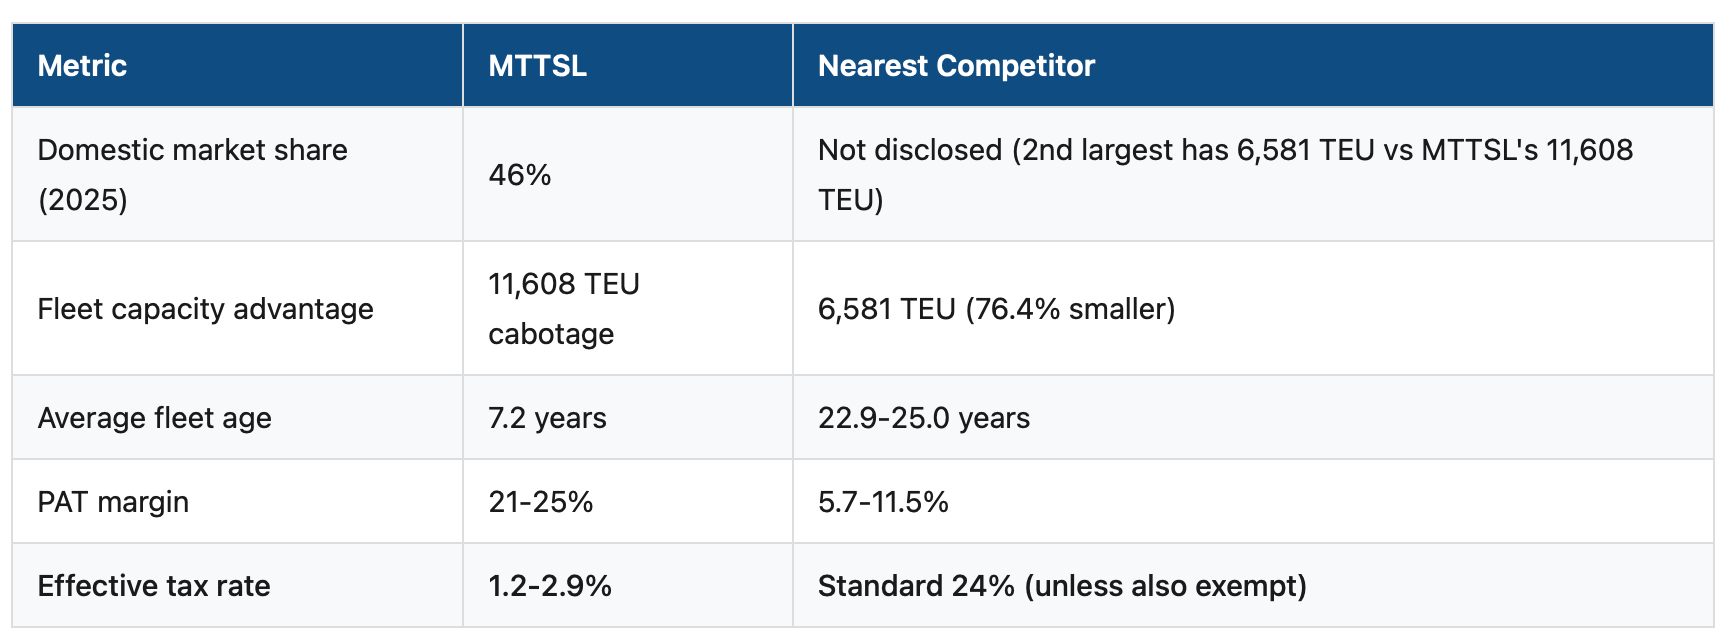
Largest domestic carrier: 41% market share in 2024, rising to 46% in 2025
Dedicated cabotage capacity of 11,608 TEUs — 76.4% more than the second-largest competitor
46.4% of Malaysian-flagged containership fleet by unit; 59.1% by TEU capacity
No new domestic entrants since 2011 — high barriers to entry
Cabotage policy restricts domestic routes to Malaysian-flagged ships
8.2 Youngest, Largest Fleet
24 owned + 2 chartered = 26 vessels, 29,149 TEU total capacity
Average fleet age: 7.2 years vs. competitors at 22.9-25.0 years
21 vessels built between 2019 and 2025
All vessels EEXI and CII compliant (ahead of competitors on environmental regulations)
Specialised vessel designs (Bangkok-max, Kolkata-max, Rajang-max) creating route-specific advantages
8.3 Superior Profitability
14 consecutive years of profitability (FYE 2011-2024)
PAT margin of 21-25% vs. competitors at 5.7-11.5% (nearly double)
Extremely low effective tax rate (1.2-2.9%) due to vessel income tax exemption
Average operating cash flow of RM402.8M/year
8.4 Multiple Growth Vectors
4 Integrated Fulfilment Facilities (Kota Kinabalu, Pulau Indah, Kuching, Bintulu) — ~RM444M investment
8 newbuild vessels (1,092 to 3,300 TEU) for delivery Dec 2026 to Jun 2028
India Subcontinent expansion (Nhava Sheva, Mundra, Kattupalli, Chennai)
Chemical tanker diversification (2 newbuild 12,500 DWT dual-fuel methanol tankers)
Containerised automotive shipping growing at CAGR 25.6%
8.5 Improving Operational Metrics
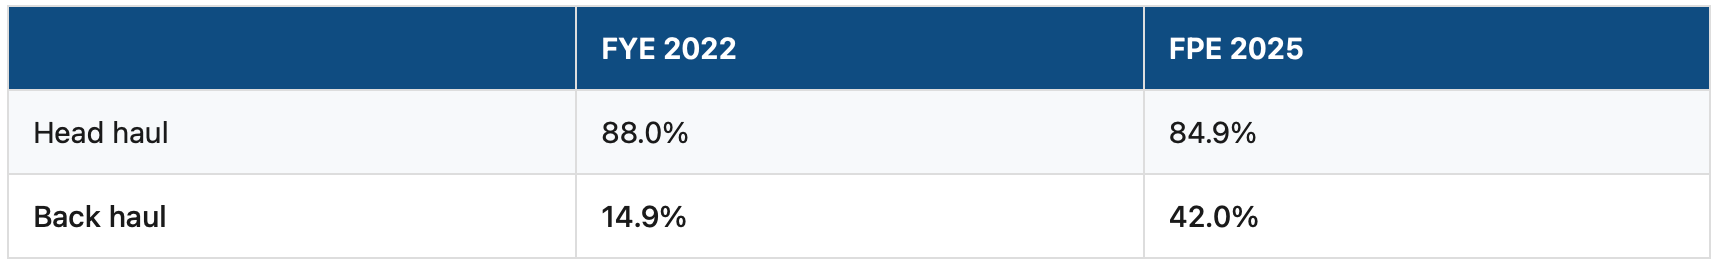
Back-haul utilisation improved from 14.9% (2022) to 42.0% (2025) — nearly tripled
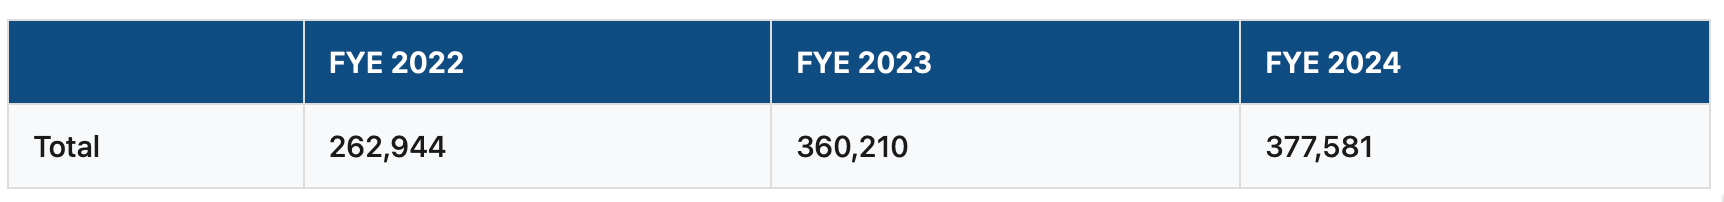
Transport volumes grew 44% from FYE 2022 to FYE 2024
Bunker fuel costs trending downward, supporting margins
8.6 Favourable Industry Dynamics
Malaysian container volumes projected CAGR 4.6% (2026-2030)
Shortage of ships below 4,000 TEU (order book ratio only 14.6% vs. 35.9% global average)
IMO environmental regulations will force scrapping of older non-compliant ships
Gemini Cooperation (Maersk + Hapag-Lloyd) at Tanjung Pelepas driving feeder volume growth
8.7 Strategic Relationships
Shipping agent for Evergreen Group since 2010
Evergreen Taiwan (via Peony) holds 28.65% of ICSD — aligned interests
Combined MTTSL + Evergreen Group = ~28% of East Malaysia port throughput
8.8 Strong Asset Base
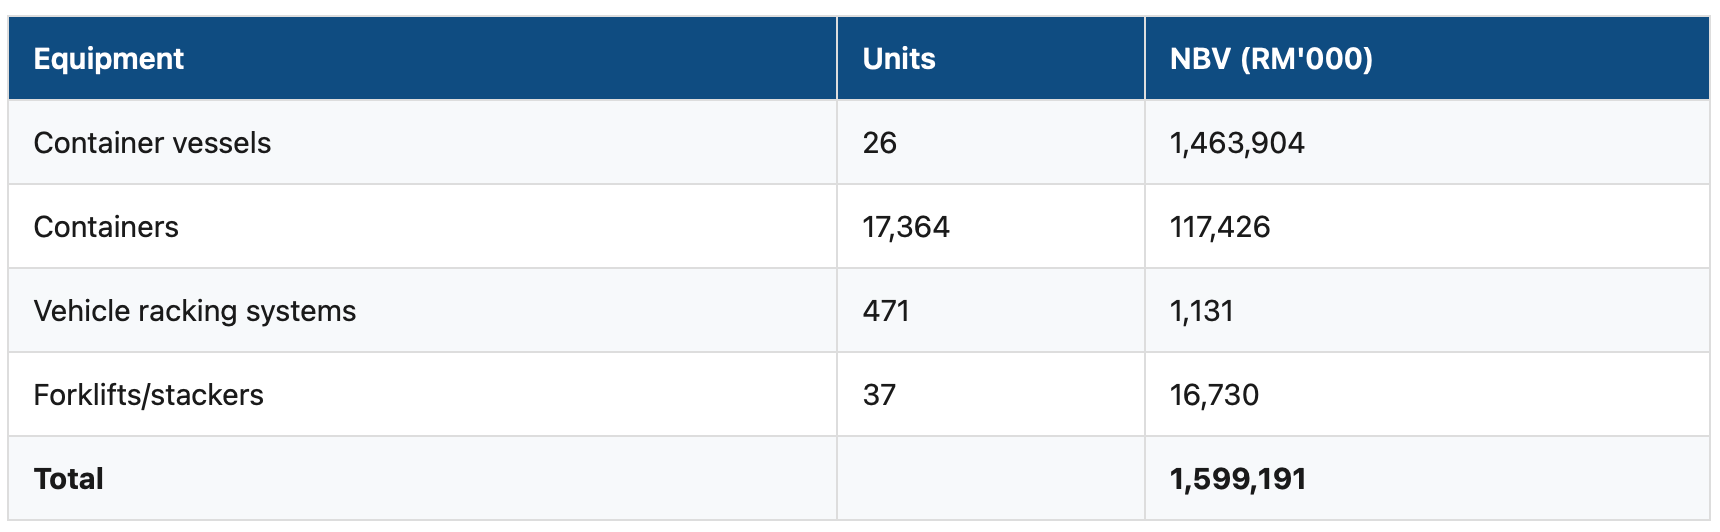
Fleet NBV: RM1,463,904,000
Property NBV: ~RM206,000,000
Clean audit opinion from KPMG with no qualifications
No contingent liabilities
99.2% trade receivable collection rate
AA3/Stable Sukuk rating
8.9 Vessel Disposal Track Record
Historically disposed vessels at 195.1% above aggregate acquisition cost
Most recent disposal (Oct 2025): MTT Pengerang sold for 249% above NBV
9. Risk Factors and Red Flags (Why NOT to Invest)
9.1 Post-COVID Normalisation
FYE 2022 was an exceptional year with inflated rates from COVID supply chain chaos
Average freight rates have declined 42% from RM2,932/TEU (FYE 2022) to RM1,694/TEU (FPE 2025)
Average vessel charter rates fell from RM127,844/day (FYE 2022) to RM73,664/day (FPE 2025)
9.2 Massive Capital Expenditure Programme
RM693.7M planned for FYE 2026 alone (mostly vessels under construction)
RM812.3M in capital commitments at the LPD
8 newbuild contracts totalling RM793.5M
4 IFFs costing ~RM444M
2 chemical tankers at RM174.1M each
This creates significant execution and leverage risk
9.3 Revenue Concentration
Freight income = 69.4% of revenue; vessel chartering = 21.6%
A downturn in container shipping would severely impact the business
Dry bulk revenue is highly volatile (RM50.5M to RM157.7M across periods)
9.4 Founder/Family Dominance
Founding group + family control vast majority of pre-IPO shares
Dato’ Seri Ong’s daughter holds key executive position (nepotism risk)
Risk Management Committee chaired by a non-independent director
Significant related party transactions (7-8% of revenue)
9.5 Cabotage Policy Dependency
Business heavily benefits from Malaysian cabotage laws protecting domestic routes
Any relaxation of cabotage rules would be a material risk to the competitive moat
9.6 Near-Term Debt Maturity
RM180M Sukuk Wakalah tranche maturing August 2026 — needs refinancing shortly after listing
Current ratio declined from 2.1x to 1.5x due to this reclassification
9.7 Dividend Uncertainty
Historical payout only 10-13% despite 50% target
Pre-IPO dividend of RM100M paid to existing shareholders before listing
Heavy capex may prevent achieving the 50% payout target for years
Sukuk Wakalah covenants may restrict dividend payments
9.8 Key Personnel Risk
Co-founders aged 59-71; succession planning is critical
New CFO (joined March 2025, less than 1 year before IPO)
Deep industry relationships are personal to the founders
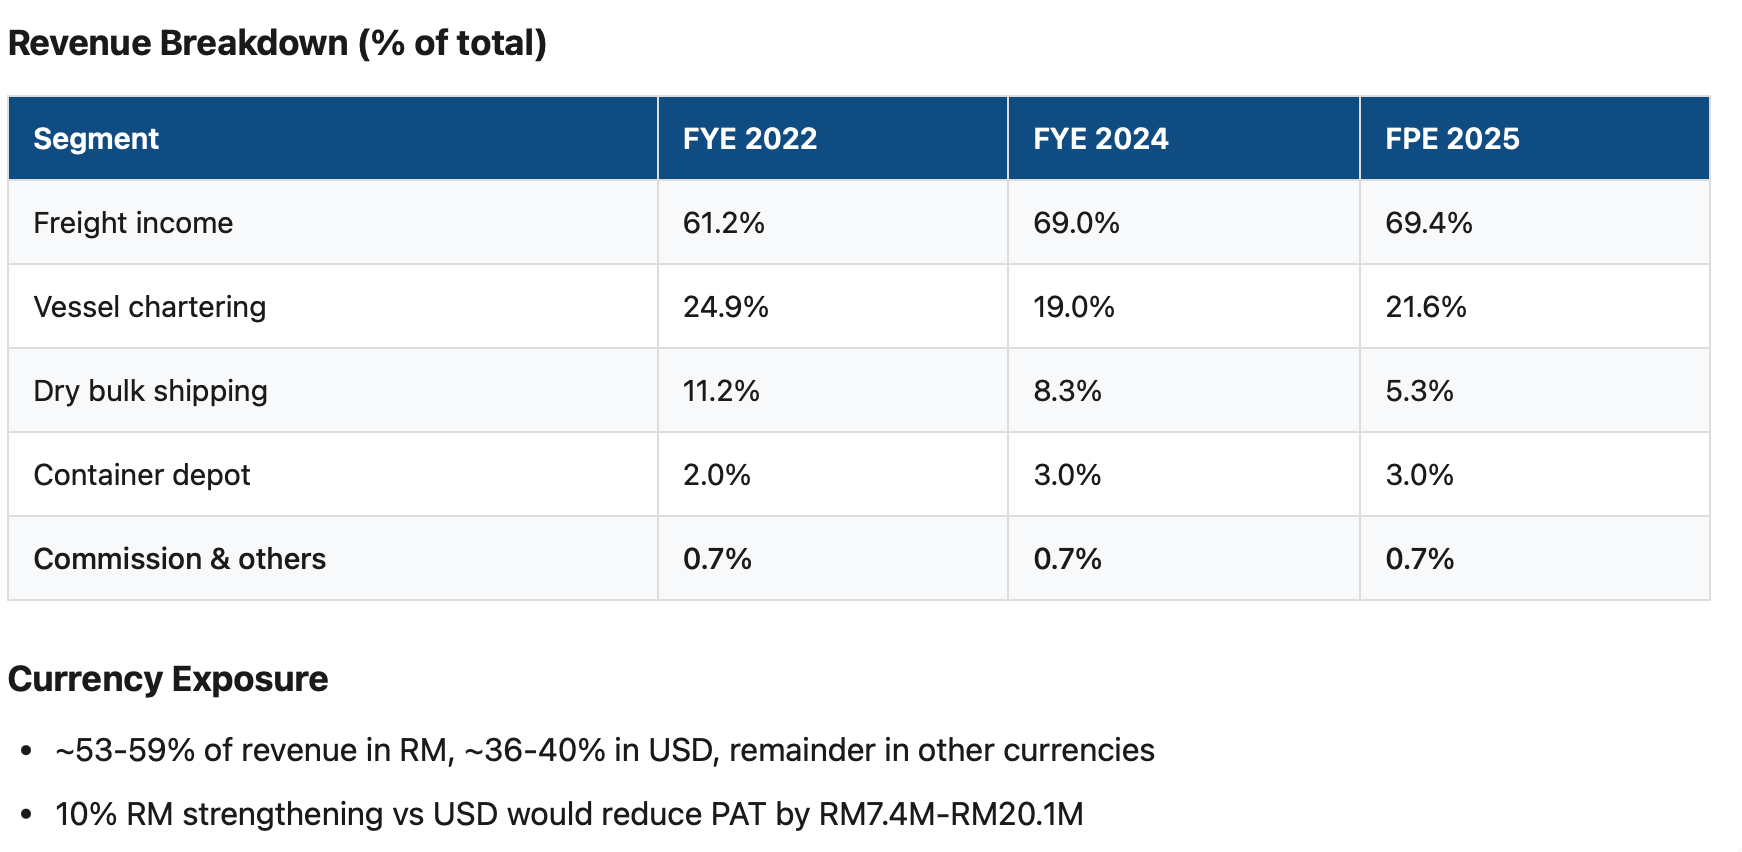
9.9 Foreign Currency Exposure
~38-40% of revenue in USD
10% RM strengthening vs USD would reduce PAT by RM7.4M-RM20.1M
9.10 Property and Regulatory Issues
Multiple operating properties lack CCC/OC (Certificate of Completion and Compliance / Occupancy Certificate)
Westports Depot lease expired at prospectus date; transition to Pulau Indah depends on obtaining CCC
Provisional land title for Sarawak property (RM9.59M asset with title uncertainty)
Several vessel certificates expiring in 2026, some very close to prospectus date
9.11 Other Concerns
Previous IPO withdrawal in 2021 (market timing questions)
2 oldest vessels aged 29 and 31 years (increasing maintenance/compliance costs)
Heavy reliance on foreign crew (regulatory and labour supply risk)
Tug and barge operating on temporary licences only (expiring within 2 months of prospectus)
Complex group structure with 40+ subsidiaries, many dormant
ESOS could dilute shareholders by up to 5%, with post-listing options at up to 10% discount
Limited IP portfolio (1 software copyright, 3 trademarks, no patents)
No order book / forward visibility due to nature of business
10. Related Party Transactions
Revenue from Related Customers
Costs to Related Suppliers
9 related entities identified with overlapping directors/shareholders
Board says loss of related customers would only cost ~RM18.6M PAT (7.3% of combined FYE 2024 PAT)
All transactions at arm’s length on normal commercial terms (per Board)
Audit Committee reviews all potential conflicts
Adviser Conflicts
CIMB (Principal Adviser, Underwriter): Has RM267.4M in credit facilities to the Group; also Sukuk facility/security agent
Affin Hwang (Joint Bookrunner, Underwriter): Has RM317.6M in credit facilities; holds RM94.5M of MTT Shipping’s notes
11. Fleet Summary
Current Fleet (26 vessels, 29,149 TEU total capacity)
24 owned vessels + 2 chartered
Average fleet age: 7.2 years (youngest in Malaysia)
21 vessels built between 2019 and 2025
11 vessels currently chartered out at USD8,250-USD29,750/day
4 vessels fitted with EGCS scrubbers (only Malaysian-flagged vessels with scrubbers)
All vessels EEXI and CII compliant
Orderbook (8 newbuilds)
1,092 to 3,300 TEU capacity
Total cost: RM793.5M
Delivery: December 2026 to June 2028
Plan to acquire at least 4 additional vessels beyond these 8
Material Equipment (NBV as at 30 Sep 2025)
12. Key Operational Metrics
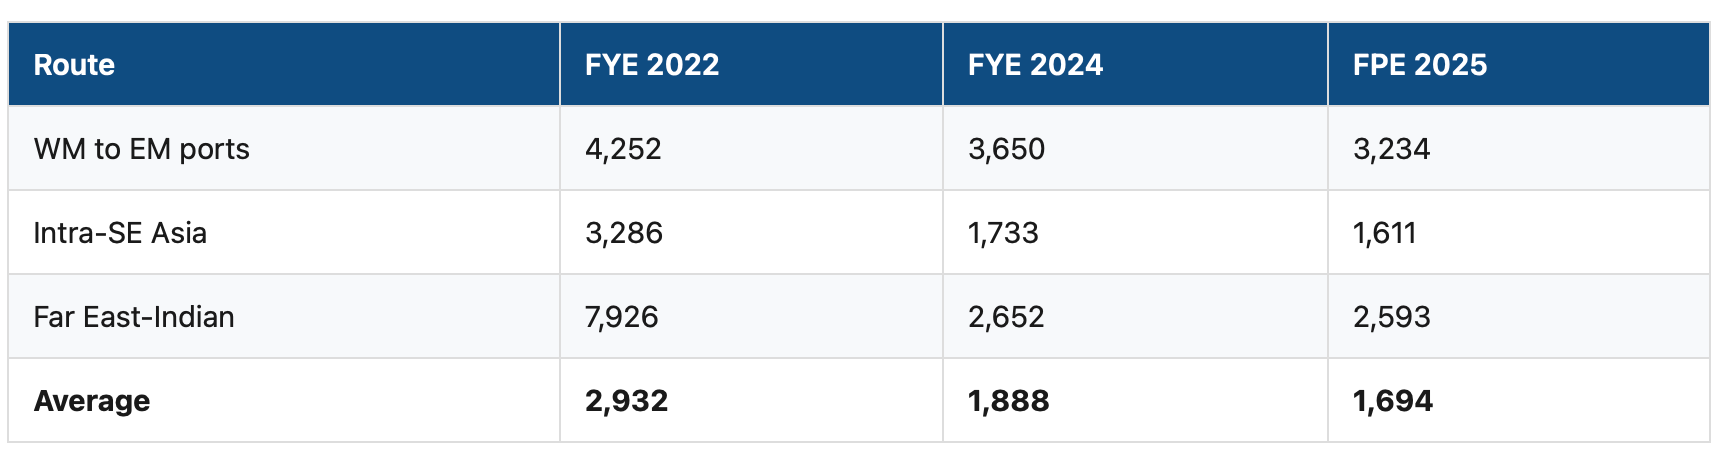
Average Freight Rates (RM per TEU)
Transport Volumes (TEUs)
Head / Back Haul Utilisation
Automotive Vehicles Transported
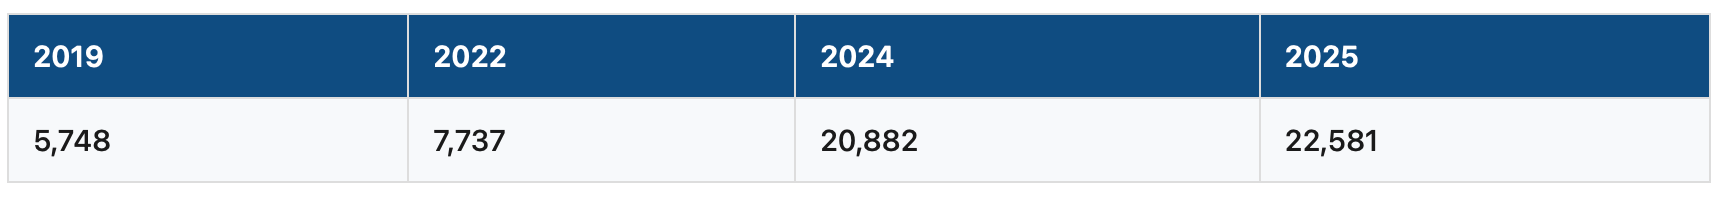
CAGR 25.6% (2019-2025), more than double the 9.6% total market growth.
13. Industry Outlook
Positive
Malaysian container volumes projected CAGR 4.6% (2026-2030)
Shortage of ships below 4,000 TEU (order book ratio only 14.6%)
IMO environmental regulations forcing scrapping of older non-compliant vessels
Suez Canal diversions since Dec 2023 increasing vessel demand
National Transport Policy targets 90% general cargo in containers by 2029
Current charter rates for 1,100-1,700 TEU ships still 161-225% above Jan 2020 levels
Negative
Charter market rates are cyclical and declining from 2022 peaks
Global trade tensions and tariff uncertainties
Bunker fuel price volatility
Terminal handling charges regulated by government (limited pricing flexibility)
14. Determining Factors of Profitability
These five factors are the primary levers that determine whether MTTSL makes more or less money. Each is backed by data from the prospectus.
14.1 Freight Rates
Freight rates are the single biggest driver of profitability. Freight income is 69.4% of total revenue (FPE 2025), and MTTSL has no long-term locked-in contracts — the prospectus states “no order book maintained due to nature of business”, meaning revenue reprices with the market.
Average Freight Rates (RM per TEU)
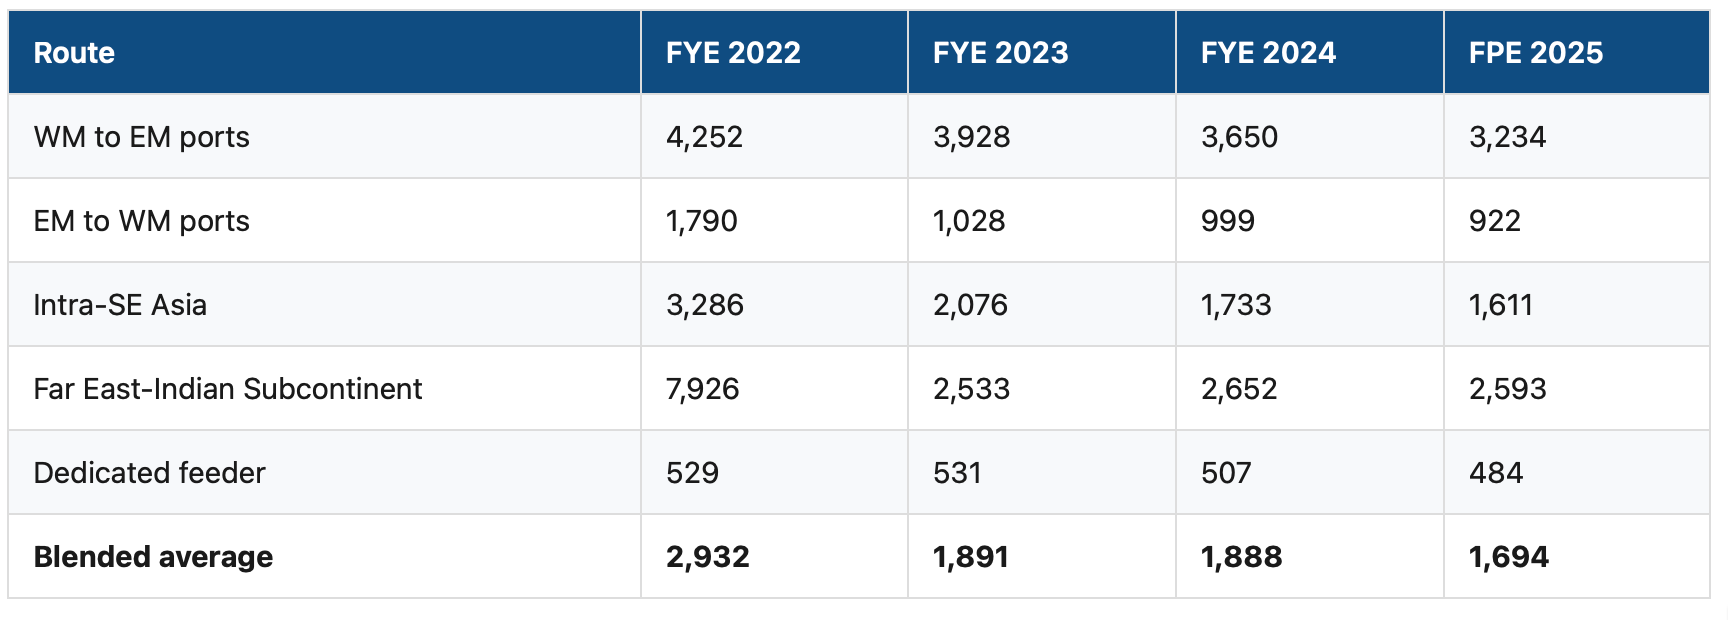
The blended average rate dropped 42% from FYE 2022 to FPE 2025. This directly flows into gross profit:
The same applies to vessel chartering (21.6% of revenue). Charter hire rates declined from RM127,844/day (FYE 2022) to RM76,334/day (FYE 2024) before partially recovering to RM78,734/day in FPE 2025. Charter contracts are renewable at prevailing market rates, with most charter lease receivables due within 1 year (RM258.8M vs only RM77.6M in year 2), confirming short-term repricing exposure.
Impact: When freight and charter rates were elevated in FYE 2022 (COVID-era), PAT was RM553M. As rates normalised, PAT fell to RM254M (FYE 2024) — a 54% drop despite volumes growing 44%. Rates overpower volumes.
14.2 Bunker Fuel Costs
Bunker fuel is the 2nd largest direct cost at 16.5% of total direct costs (FPE 2025), totalling RM106.8M for the 9-month period.
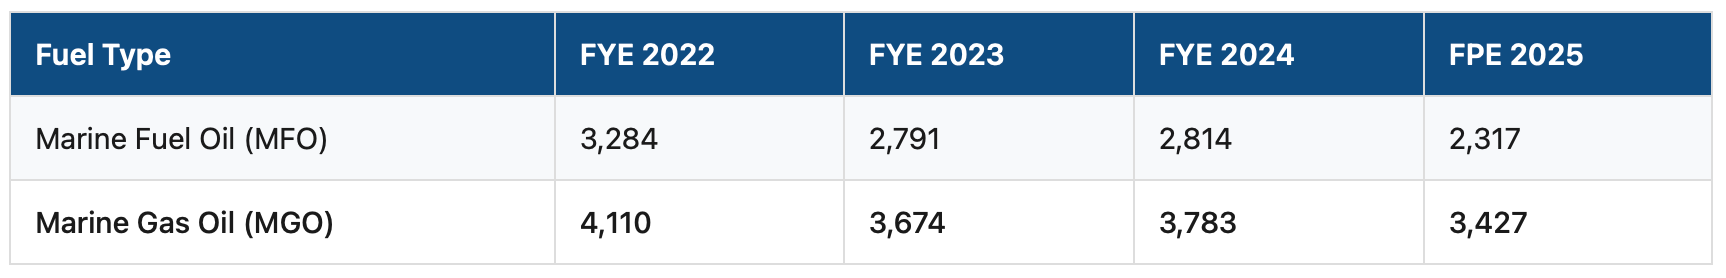
Average Bunker Fuel Prices (RM per Metric Ton)
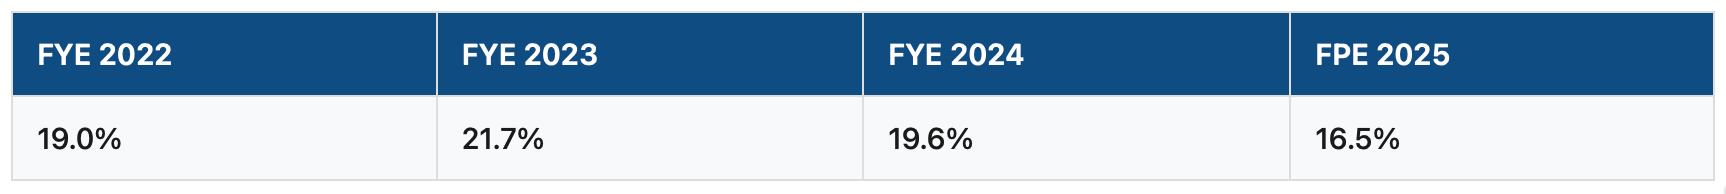
Bunker fuel as % of direct costs over time
The declining fuel cost from FYE 2022 to FPE 2025 (MFO down 29%) contributed to the GP margin recovery from 27.6% (FYE 2024) to 32.7% (FPE 2025).
Mitigation — Bunker Adjustment Factor (BAF): MTTSL applies a fuel surcharge on freight rates to partially pass through fuel costs to customers. However, this is imperfect — there is a time lag in adjustments, competitive pressure may limit full pass-through, and no financial hedging (futures/swaps) is disclosed in the prospectus.
Scrubber advantage: 4 vessels are fitted with EGCS scrubbers (the only Malaysian-flagged vessels with scrubbers), allowing them to burn cheaper high-sulphur fuel oil while meeting IMO 2020 emissions requirements, giving a direct fuel cost advantage on those vessels.
Impact: Fuel is a cost MTTSL cannot fully control. When oil prices spike, margins compress until BAF catches up. When fuel prices fall (as in FPE 2025), margins expand. The FPE 2025 GP margin recovery to 32.7% was partly driven by MFO prices falling 18% from FYE 2024.
14.3 Asset Utilisation & The “Backhaul” Problem
A vessel sailing full in one direction and empty on the return is burning the same fuel, paying the same crew, and incurring the same port charges — but earning revenue on only one leg. The backhaul problem is a structural feature of MTTSL’s core cabotage route: manufactured goods flow from Peninsular Malaysia to East Malaysia, but far less cargo flows back.
Head Haul vs Back Haul Utilisation
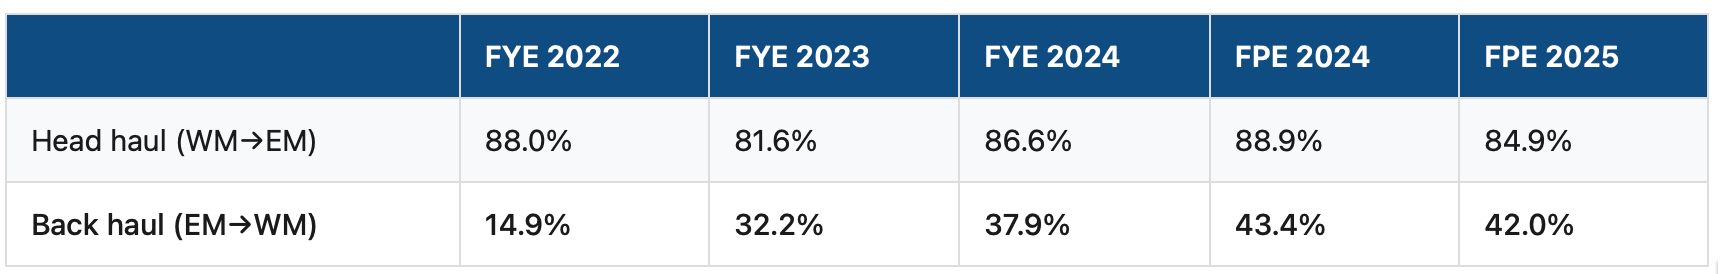
Backhaul utilisation has nearly tripled from 14.9% (FYE 2022) to 42.0% (FPE 2025). This is one of the most significant profitability improvements in the prospectus because every additional backhaul TEU is almost pure incremental margin — the vessel is making the return trip anyway.
Volume evidence (TEUs)
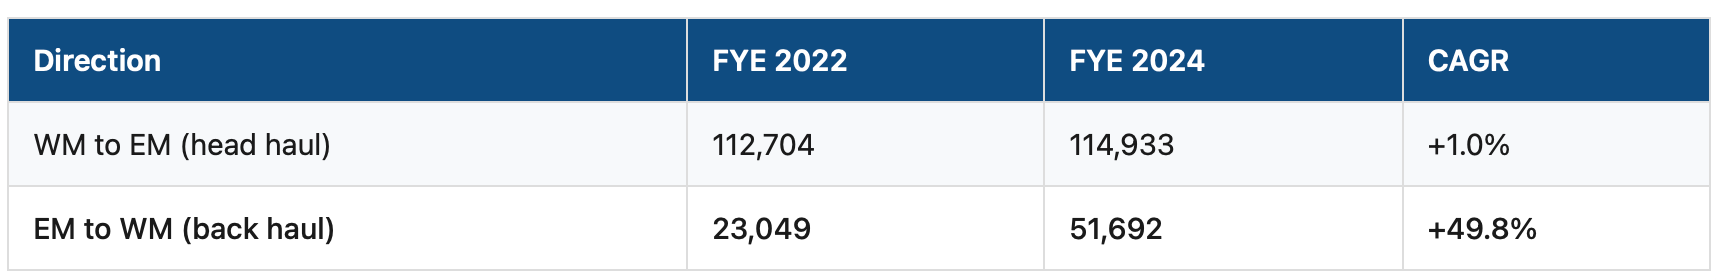
Backhaul volumes grew at 49.8% CAGR while head haul was essentially flat. The revenue per TEU on backhaul (RM922 FPE 2025) is much lower than head haul (RM3,234), but the incremental cost of carrying that cargo is minimal since the vessel and crew costs are already incurred.
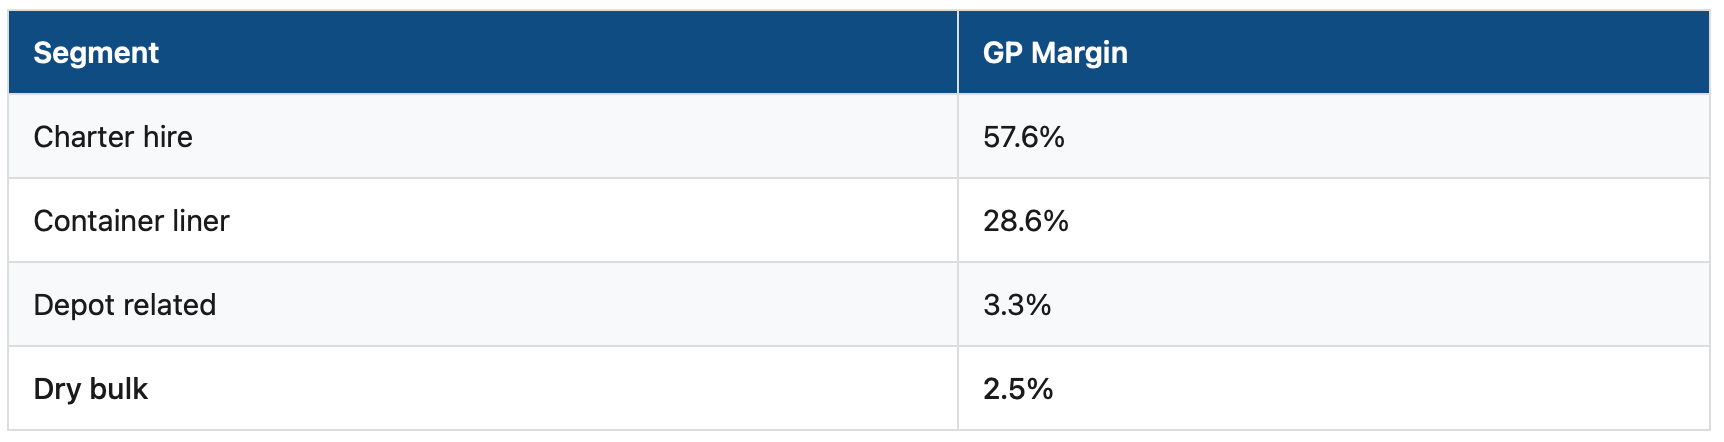
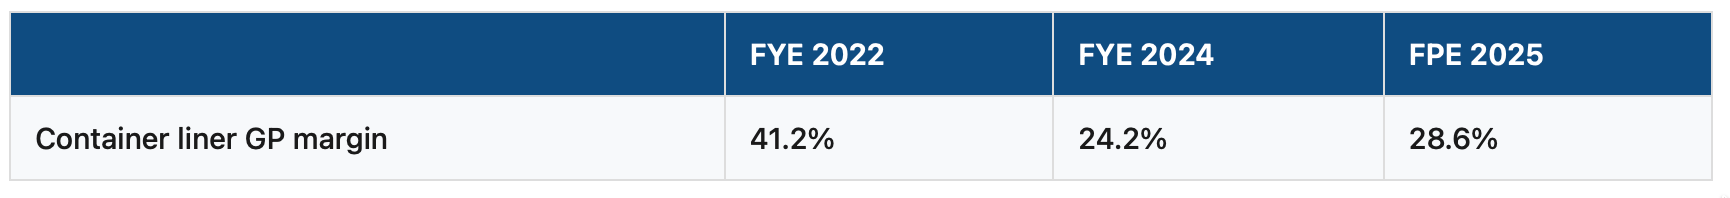
Fleet utilisation also matters for chartering. Of 26 total vessels, 11 are chartered out when not needed for liner operations. This dual deployment (liner when demand is high, charter when it’s not) maximises asset utilisation. However, the charter hire GP margin of 57.6% is far higher than container liner’s 28.6%, meaning fleet allocation decisions between own-use and chartering directly impact overall profitability.
Impact: The backhaul improvement from 14.9% to 42.0% materially contributed to profitability resilience even as freight rates declined. If backhaul continues improving, it provides an earnings floor. If it reverses, margins would compress further.
14.4 Port Turnaround & Congestion
Port-related costs are the largest and third-largest direct cost categories:
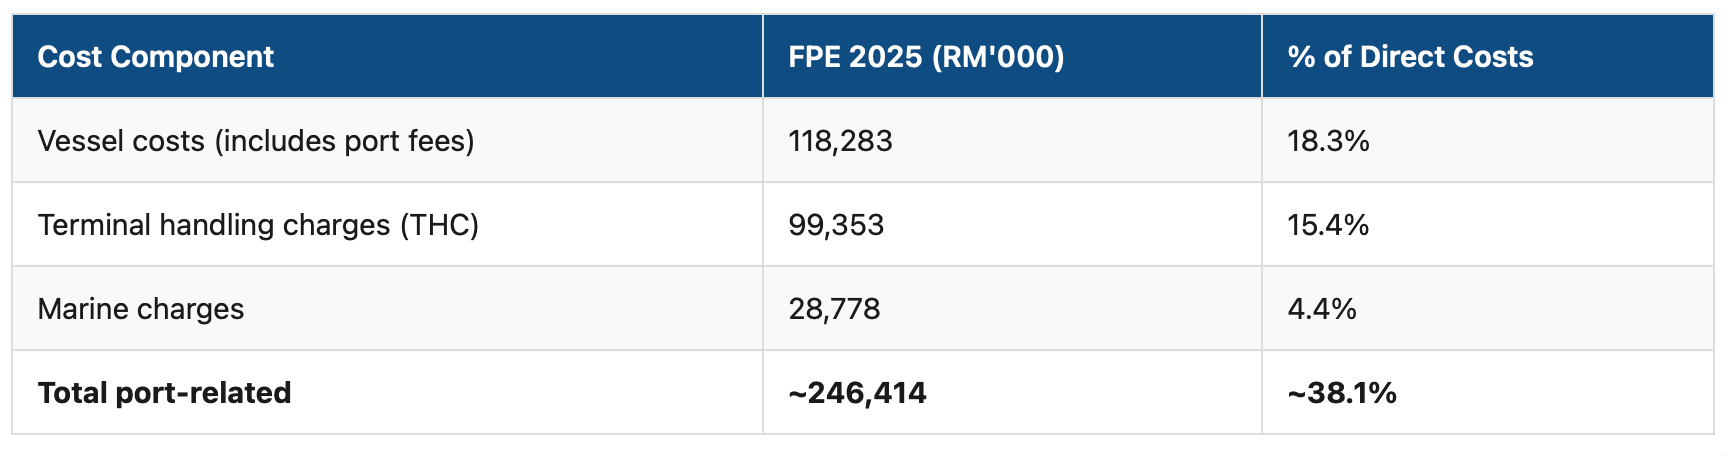
Port-related costs collectively represent ~38% of direct costs — more than double the fuel cost.
Terminal handling charges (THC) are particularly notable because they are regulated by the Malaysian government, meaning MTTSL has limited ability to negotiate them down. THC increased from RM95,330K (FYE 2022) to RM99,353K (FPE 2025, 9 months), growing significantly even as the company’s own freight rates declined.
MTTSL’s mitigation strategy is port frequency and network density:
25 port calls per week at Port Klang alone
8 ports in East Malaysia with at-least-weekly service
Fixed weekly sailing schedules since 2011
Specialised vessel designs (Bangkok-max, Kolkata-max, Rajang-max, Pengerang-max) built to maximise cargo capacity within specific port constraints (draft, beam, LOA limitations)
These purpose-built vessels reduce port turnaround time because they are optimised for the exact berth and channel constraints of their designated routes, allowing maximum cargo per call.
The IFF strategy also addresses this: The 4 planned Integrated Fulfilment Facilities (Kota Kinabalu, Pulau Indah, Kuching, Bintulu) are designed to reduce reliance on third-party depots and consolidate cargo handling, which should improve turnaround efficiency and reduce per-unit handling costs over time.
Impact: Port costs are large, partially government-controlled, and growing. MTTSL’s ability to manage this through vessel design, schedule density, and vertical integration (own depots/IFFs) is a key determinant of whether margins hold or compress further.
14.5 Regulatory Moats
The cabotage policy is the foundational reason MTTSL’s profitability is structurally higher than what a purely competitive market would allow. Their PAT margin of 21-25% versus competitors at 5.7-11.5% is not purely operational excellence — it is substantially underpinned by regulatory protection.
Cabotage policy: Malaysian law restricts domestic shipping routes (Peninsular Malaysia ↔ East Malaysia, inter-East Malaysia) to Malaysian-flagged vessels. This means:
Foreign carriers cannot compete on MTTSL’s core domestic routes
No new domestic entrants since 2011 — the cost of acquiring vessels + Malaysian reflagging requirements creates prohibitive barriers
Even a 2017 relaxation allowing foreign carriers on certain routes failed to increase their market share
MTTSL holds 46.4% of all Malaysian-flagged containerships by unit count; 59.1% by TEU capacity
Tax exemption: Profits from operation of Malaysian-registered vessels are exempt from taxation under Section 54A(1) of the Income Tax Act. This is why MTTSL’s effective tax rate is only 1.2-2.9%, compared to the standard 24% corporate rate. On FPE 2025 PBT of RM242.8M, the tax saving versus a normal rate is approximately RM51M — this alone adds roughly 5 percentage points to PAT margin.
IMO environmental regulations (EEXI/CII): All 26 MTTSL vessels are EEXI and CII compliant. The IMR report cited in the prospectus notes that these regulations will force scrapping of older non-compliant ships, further tightening vessel supply. Competitors’ fleets average 22.9-25.0 years old versus MTTSL’s 7.2 years, meaning competitors face greater regulatory obsolescence risk.
Combined regulatory effect on market position
Risk: These regulatory advantages can be removed. If the cabotage policy is relaxed further or the Section 54A tax exemption is repealed, MTTSL’s margin superiority would narrow significantly. The prospectus identifies cabotage dependency as a risk factor but provides no mitigation beyond the company’s scale and service quality advantages.
Impact: The regulatory moat is arguably the most important factor of all five. It protects pricing power (limited competition), ensures near-zero tax (Section 54A), and creates barriers that prevent new entrants from diluting market share. Without it, MTTSL would be a fundamentally different investment proposition.
14.6 Oil Price Spikes & Geopolitical Disruption — How MTTSL Is Positioned
The effect of oil price spikes on shipping stocks depends on the type of shipping company and the cause of the spike. The March 2026 Strait of Hormuz closure following US/Israel strikes on Iran provides a real-time case study:
Crude tanker operators (e.g. Frontline, up 51% YTD) benefit massively — route disruptions force longer voyages, tightening vessel supply and spiking tanker day rates far faster than bunker costs rise. Frontline secured 7 VLCC time charters at USD76,900/day, well above historical averages.
Container liners (e.g. Maersk, Hapag-Lloyd) get mixed results — higher bunker costs squeeze margins, with only lagged pass-through via freight surcharges.
Dry bulk operators are generally hurt — their cargo demand (iron ore, coal, grain) is tied to global economic health, and oil spikes are stagflationary.
Post-COVID research (ScienceDirect, 2025) found the oil-freight relationship has flipped in supply-shock scenarios: higher oil prices now signal broader supply constraints that push freight rates up faster than costs, reversing the pre-2021 pattern of pure margin compression.
Where MTTSL sits in this framework
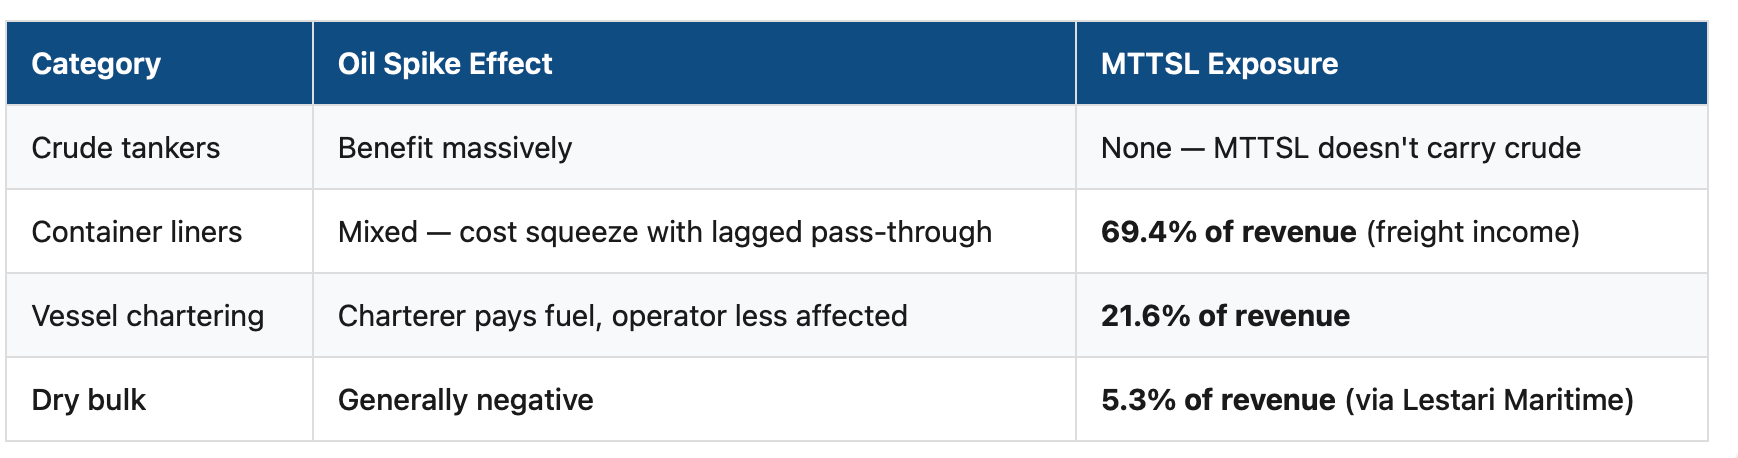
What helps MTTSL in a disruption:
11 of 26 vessels are chartered out — the charterer pays for fuel, so 21.6% of revenue is insulated from bunker cost spikes
Route disruptions tighten global vessel supply, supporting charter rates on renewal. The prospectus already notes Suez Canal diversions since Dec 2023 increased vessel demand
The shortage of ships below 4,000 TEU (order book ratio only 14.6%) means supply cannot respond quickly to higher demand
What hurts MTTSL in a disruption:
Higher bunker costs hit their own liner operations directly (69.4% of revenue), with BAF pass-through that is periodic and lagged, and no financial hedging disclosed
Their core cabotage routes (Peninsular ↔ East Malaysia) are domestic — not affected by Hormuz or Suez disruptions, meaning they bear the fuel cost increase without the corresponding freight rate spike that international routes see
Dry bulk segment (5.3% of revenue) would weaken if global trade slows from stagflationary pressure
Net assessment: MTTSL is not a play on oil disruption or geopolitical risk. Their domestic cabotage dominance means they are somewhat insulated from global route disruptions, but they also don’t benefit from them the way tanker companies do. In an oil spike scenario, the primary impact is cost inflation on bunker fuel eating into liner margins, partially offset by the charter segment where fuel cost sits with the charterer.
15. Property Portfolio
Owned Properties: 14 material properties, ~RM206M total NBV
1 freehold (HQ in Shah Alam, RM26.0M)
13 leasehold (29-94 years remaining)
6 vacant land parcels (~RM77.5M) for future development
Heavy concentration in Pulau Indah, Klang (~RM62.2M across 6 properties)
Rented Properties: 3 material leases
Westports Depot lease expired at prospectus date (transitioning to owned Pulau Indah site)
Pasir Gudang Depot (RM90,822/month, expiring Mar 2027, new 3-year agreement from Apr 2027)
Perai Depot (RM86,320/month, expiring Jun 2026)
Property Red Flags
Multiple properties operating without CCC/OC
1 property on provisional land title (Sarawak)
Most properties charged as security for bank borrowings
16. Corporate Governance
Positive
Board committees appropriately constituted with INED majorities
No bankruptcy/criminal proceedings against any director in past 10 years
Boardroom diversity target: at least 30% women directors
Clean compliance record across all maritime regulations
Concerns
Risk Management Committee chaired by non-independent executive director
No service contracts with termination benefits for KSM (less formal structures)
Heavy founder/family concentration in ownership and management
ESOS allows up to 70% of options to Directors and senior management
Board can extend ESOS from 5 to 10 years without shareholder approval
17. Quick Reference — Numbers That Matter
18. Summary Verdict Framework
Bull Case
Dominant market position in protected cabotage market with no new entrants since 2011
Youngest, largest fleet with superior profitability (2x competitor margins)
Near-zero effective tax rate is a massive structural advantage
Strong cash generation funds aggressive growth programme
Favourable supply-demand dynamics for small containerships
Multiple growth engines (IFFs, fleet expansion, automotive, chemical tankers, India)
At ~8x P/E, reasonably priced for a market leader
Bear Case
Post-COVID rate normalisation has compressed revenues and margins significantly
Enormous capex programme (RM800M+ commitments) creates execution and leverage risk
IPO proceeds go entirely to vessel purchases, not de-risking the balance sheet
Historical dividend payout (10-13%) far below 50% target; heavy capex may persist for years
Founder/family dominance with key-man risk (ages 59-71)
Cabotage policy change would destroy the competitive moat
Charter rate cyclicality means earnings could fall further if global shipping weakens
RM180M Sukuk maturity in August 2026 needs immediate refinancing
This analysis was compiled from all 672 pages across three parts of the MTTSL Prospectus dated 26 March 2026. It is intended as a summary of investment-relevant information only and does not constitute investment advice. Investors should read the full prospectus and conduct their own due diligence.